
Are you not meeting your sales targets? Do you feel like your current strategies just aren’t working anymore? Or maybe you are finding it tough to gauge your team’s performance. If you can relate to all this — you are in the right place. Solving these issues is very simple when you have an accurate, well-researched and easy-to-understand sales report to guide your decision-making.
In our guide, we’ll show you how to craft the perfect sales report that caters specifically to your team, sales targets and key business areas, so you can discover exactly where your problems lie.
Is a particular product not selling as expected?
Is a team member unable to convert leads?
Is a region having an unexpected dip in sales?
A sales report helps you look closely at your sales data to figure out how your business is doing. It breaks down your sales by different categories — product, region or salesperson — so you can see clearly what’s working and what isn’t.

Don’t dismiss a sales report as just a summary of how many items you sold in a quarter. It helps you understand the bigger picture — why some products are hot sellers while others aren’t and how well your sales strategies are working in different markets.
A well-crafted sales report gives you all the insights you need to make smart business decisions and boost your revenue.
Here are a few key benefits of sales analysis reports:
A sales report is incredibly useful in identifying trends and patterns in your current sales process. For instance, certain products might consistently sell well during the festive or holiday seasons. With this info in your report, you can modify your inventory before the festive season, tweak your marketing campaigns highlighting your best sellers and prepare your sales team in advance for the incoming rush.
With sales reports, you can make better decisions that significantly improve both your strategic and tactical approaches. With detailed insights, you can quickly iterate your strategies, like shifting focus to high-performing products or adjusting tactics in response to a sales slump. This helps you respond promptly to market changes and ensure your business remains competitive and in tune with customer needs.
A detailed sales report is your key to understanding the individual and overall performance of your team members. This allows you to recognise their achievements, boosting their morale and overall sales team productivity. At the same time, you can pinpoint areas where specific training or resources are needed to address any performance gaps.
A sales report will also get you all the information you need about your customer’s buying habits and preferences, which can be leveraged to create more targeted and effective marketing strategies. By analysing this data, you can identify which products are popular among different customer segments, what times of the year certain items sell best and how your marketing campaigns impact sales. Moreover, these insights enable you to personalise your marketing, increasing engagement and loyalty towards your brand.
Creating a sales report requires a systematic approach to make the report more accurate so that it provides actionable insights into all important aspects of your business. Let’s break down the essential steps to crafting an effective sales report:

You need to start with a clear understanding of your sales report’s purpose, the audience it’s intended for and the metrics that will be most relevant and insightful for the report. This foundational step ensures that the report is focused, meaningful and actionable.
Clearly defining the purpose of your report will hold you in good stead when creating the report.
Identify objectives: Are you aiming to track progress towards sales targets, understand market trends, evaluate the performance of sales strategies or provide insights for future planning? You need to pinpoint the specific objectives that will help determine what data needs to be collected and analysed.
Set clear goals: What do you want to accomplish with this report? Is it to highlight your sales team’s achievements, keep senior management posted on your team’s progress, identify areas for improvement or justify resource allocation? Setting clear goals will ensure that the report provides actionable insights to address your business needs.
Before you start drafting the report, understand who you are making it for because different stakeholders will have different needs and expectations. You have to make sure the report is tailored according to your audience, so it’s relevant and useful for them.
Senior executives: They are typically interested in high-level insights and strategic overviews. You should be focusing on metrics such as overall sales performance, growth trajectories and any other major highlights or concerns of your department.
Sales managers: They require detailed information on individual and team performance and specific areas needing improvement. You need to include metrics like individual sales targets, conversion rates and overall performance.
Sales team: Your sales team needs insights that can help them improve their day-to-day activities. This might include detailed breakdowns of sales by product, customer feedback and any short-term trends or patterns.
Other stakeholders: Consider any other stakeholders who might benefit from the report, such as the marketing team (for customer and lead source insights) or finance team (for revenue tracking). You can tailor sections of the report to provide the information they need if and when required.
Choosing the appropriate metrics is imperative for a sales report to be informative and actionable. The metrics should align with the report’s purpose and be relevant to the audience.
Total sales: This basic but crucial metric shows the overall revenue generated by your business and is vital for understanding the overall performance
Sales growth: Measuring the increase or decrease in sales over a particular period helps identify trends and evaluate the effectiveness of your sales strategies
Conversion rates: This metric shows the percentage of leads you are converting into customers and provides you with insights into the efficiency of your sales process
Customer acquisition cost (CAC): This helps you understand how much it costs to acquire a new customer and evaluate the return on investment for your marketing and sales efforts
Average deal size: This metric indicates the average revenue per sale, which can help identify whether your team is focusing on high-value deals
Sales by region: Breaking down sales by geographical regions helps identify strong and weak markets so that you can tweak your strategies in those regions accordingly
Sales by product/service: Understanding which products or services are performing well can guide inventory decisions and marketing focus
Sales cycle length: Knowing the average time it takes to close a sale helps in assessing the efficiency of your sales process

After defining the purpose and audience for your sales report, the next step is to specify the time frame your report will cover and ensure that data is collected and organised systematically. This step is crucial for providing relevant and actionable insights while minimising errors.
Choosing the right time frame for your sales report is a necessary step because it determines the scope of your analysis and the relevance of your insights.
Determine the period: Decide whether your report will cover daily, weekly, monthly, quarterly or annual data. This decision should be based on the goals of your report and the frequency at which decisions need to be made. For example, a daily report might be useful for tracking immediate sales activities, while a monthly report can help in evaluating trends for the past month.
Consistency: Stick to a consistent time frame in your reports. This allows you to compare performance over similar periods and identify changing trends. For instance, comparing your monthly sales data for the current year with that of the past year will help you understand seasonal patterns.
Sync with sales cycles: Align your reporting time frame with your business cycles or sales campaigns. If your business operates on a quarterly basis, a quarterly sales report makes the most sense.
Reliable data is the backbone of any effective sales report. So, once the time frame is set, the next step is to gather accurate and comprehensive data.
Identify data sources: Common sources include CRM systems, sales databases, accounting software and marketing platforms. Ensure that data from these sources is up-to-date and extracted in a proper manner. Consider using a curl proxy to securely fetch data from different sources
Ensure data accuracy: Double-check the data for errors or inconsistencies before including it in your report. Inaccurate data will lead to incorrect conclusions and poor decision-making.
Collect relevant data: Focus on collecting data that aligns with the metrics you have chosen. For example, if you are measuring customer acquisition costs, ensure you have all related expenses and sales figures.
Organising your data effectively makes analysis easier and ensures that your report is clear and comprehensible.
Categorise data: Organise your data into meaningful categories, such as by product type, region, salesperson or time period. This helps identify specific areas of success or concern.
Use spreadsheets and tools: Make use of tools like spreadsheets, CRM software or any data visualisation tools to organise your data. These tools can help you sort, filter and analyse large data sets in a much more efficient manner.
Create a data layout: Develop a layout for presenting your data and stick to that. It could be in any format — tabular, charts or graphs. Consistency in layout helps in quickly comparing data across different reports.
Pro Tip
If you are creating a monthly sales report, do the following:
Choose the first day of the month as the start date and the last day as the end date.
Gather data from your CRM system on all sales teams’ activities within that month.
Ensure all data entries are accurate, including sales figures, customer interactions and lead conversions.
Organise this data by sales regions and individual sales reps.
Use a spreadsheet to sort and filter the data, making it easier to analyse and visualise trends.

Now that you have defined your purpose, identified your audience, selected your metrics and collected and organised your data, the next step is to analyse the data to draw insights and provide actionable recommendations. This step is where the real value of your sales report comes to light.
Data analysis involves examining your data to uncover trends, patterns and anomalies that provide a deeper understanding of your sales performance.
Examine trends and patterns: Look for recurring themes in your data. Are sales increasing during certain times of the year? Is there a particular product that consistently outperforms others? Identifying these trends helps you understand what’s driving your sales and what else you can do to improve it.
Identify anomalies: Spot any outliers or unusual data points. For example, a sudden drop in sales in a usually strong region might indicate an external issue, such as increased competition, market changes or quality issues.
Segment your data: Break down your data into segments, such as by product line, region or salesperson. This segmentation allows you to pinpoint specific areas of success or concern and understand the factors contributing to those results.
After analysing the data, the next step is to extract meaningful insights from it.
Performance evaluation: Evaluate overall performance as well as the performance of individual products, regions or sales reps. Are your top-performing products or regions consistent with your expectations? Are there any underperforming areas that need attention?
Customer behaviour: Which products are most popular among different customer segments? Are there trends in customer buying patterns that you can leverage? Understanding the customer’s behaviour and their preferences is an important insight and shouldn’t be overlooked.
Market trends: Recognise broader market trends impacting your sales. For instance, are there external factors like economic changes or industry shifts that are influencing your sales performance?
Based on your analysis and insights, you can now provide actionable recommendations that can help improve sales performance and strategic decision-making.
Actionable steps: In your report, suggest specific actions to address identified issues or capitalise on positive trends. For example, if a product is not getting the traction it should, you can recommend a targeted marketing campaign or a discount strategy to boost sales.
Strategy adjustments: Recommend adjustments to your sales management strategies based on the insights gained. This might involve reallocating more resources to unprofitable regions, providing additional training for underperforming sales reps or introducing new sales tactics.
Future planning: If certain trends are likely to continue, plan accordingly by setting realistic sales targets and developing strategies to achieve those targets.
Pro Tip
For instance, after analysing your monthly sales data, you might discover that:
Sales of a particular product have been consistently high in the northern region but low in the southern region
Your top-performing sales rep has a significantly higher conversion rate than others in the team
A dip in sales during the monsoon season indicates a seasonal trend
Based on these insights, you could recommend:
An increase in marketing efforts for the popular product in the southern region to boost sales
A training session where the top-performing rep shares their successful techniques with the rest of the team
Preparation for the monsoon season with special promotions or discounts to counteract the expected sales dip

Once you have the data analysed and actionable insights drawn, the next step is to present your findings in a clear and compelling manner to stakeholders. A visually appealing report has better recall with your audience and helps them quickly grasp the provided information.
A well-organised and visually appealing presentation of your sales data makes it easier for your audience to grasp key points quickly.
Use visuals: Charts, graphs and tables are excellent tools for making data more digestible. Visual aids can highlight trends, comparisons and anomalies at a glance, which is much more effective than blocks of text or raw data.
Types of visuals: Use bar charts to compare sales performance across different regions or products, line graphs to show sales trends over time and pie charts to illustrate the market share of different products.
Consistency: Maintain a consistent style and format for all visuals throughout the report to make it look professional.
Highlight key data: Use colour-coding, bold text or call-out boxes to draw attention to the most important data points to help your audience absorb key information without much difficulty.
Logical flow: Organise your report in a logical sequence, starting with an overview and then moving on to provide a detailed analysis of the objective of the report. Conclude the report with recommendations for either improving existing strategies or building new ones. This narrative structure helps the reader follow your analysis and understand the implications.
The executive summary is a crucial component of your sales report, providing a concise overview of the main findings and recommendations.
Concise overview: Include the most important metrics, significant trends and top recommendations in a summarised form in your report. This section provides a snapshot of the report’s content, allowing busy executives to grasp the essential info quickly.
Key metrics: Highlight the most relevant metrics that support your main findings. For instance, if the report shows a significant increase in sales due to a new marketing strategy, include the percentage growth and other supporting data in the summary.
Major insights: Mention any critical trends, patterns or anomalies that were identified and their implications for the business.
Recommendations: Outline the primary recommendations based on your insights. This should include actionable steps that the business will be taking to improve sales performance. Make sure these recommendations are clear and directly tied to the data presented in the report.

The final step in creating a perfect sales report is ensuring that it is accurate, polished and communicates the right intent to the concerned stakeholders. Therefore, you need to edit and review the report before distributing it to the relevant audience to facilitate meaningful discussions on the data contained in the report.
Careful editing and review are crucial to ensure the accuracy and clarity of your sales report.
Proofreading: Check for spelling, grammar and punctuation errors. These small mistakes can undermine the professionalism of your report
Consistency: Ensure consistency in formatting, terminology and visual styling throughout the report. A unified presentation makes the report look professional and easier to follow
Accuracy: Double-check all data points and calculations for accuracy. Incorrect data can lead to faulty conclusions and misguided decisions
Clarity: Simplify complex information where possible. Use straightforward language and avoid jargon to ensure that the report is accessible to all readers
You can use an online paraphrasing tool for this purpose. It can quickly simplify the given content by changing difficult terms with their easy synonyms.Once the report is polished, it needs to be distributed to the relevant stakeholders in a timely manner.
Distribution channels: Choose the best method to distribute the report. This could be via email, a shared drive, your company’s intranet or a presentation at a meeting.
Timeliness: Ensure the report is distributed promptly, especially if it contains time-sensitive information. A consistent distribution schedule helps stakeholders anticipate and prepare for any potential crisis.
Facilitating discussions around the report’s findings is essential for turning insights into action.
Schedule meetings: Arrange meetings or briefings with key stakeholders to go over the report. This provides an opportunity to discuss the findings in detail and address any questions.
Highlight key points: During discussions, focus on the most important insights and recommendations. This helps keep the conversation focused and productive.
Action plans: Collaboratively develop action plans based on the report’s recommendations. Assign responsibilities and set timelines to ensure that the necessary steps are taken.
Feedback loop: Encourage feedback on the report itself. Understanding what information was most useful or what could be improved helps refine future reports.
Sales reports come in various forms, each tailored to serve specific purposes. Understanding these different types is crucial to making the most of your sales data and improving overall sales management in your business.
A sales pipeline report gives you a detailed overview of the stages of your sales process, helping you track the progress of each deal and identify any bottlenecks.
Purpose: To monitor the health and progress of the sales pipeline
Audience: Sales managers and team leaders who need to oversee the sales process
Key metrics: Number of deals in each stage, average deal size, conversion rates between stages and deal velocity
Benefits: Allows for quick identification of bottlenecks, helps in forecasting future sales and provides insights into the effectiveness of the sales process
Use Telecrm’s Filter feature to generate pipeline reports that highlight the effectiveness of different stages in your sales pipeline without manually collecting data from multiple places.
A lead generation report focuses on the performance of various lead generation efforts, providing insights into how effectively your marketing activities are attracting new leads.
Purpose: To evaluate the effectiveness of lead-generation strategies
Audience: Marketing teams and sales managers who need to track lead generation performance
Key metrics: Number of new leads, lead source, conversion rates, cost per lead and lead quality scores
Benefits: Helps optimise lead generation strategies, improve lead quality and reduce the cost of acquiring new leads
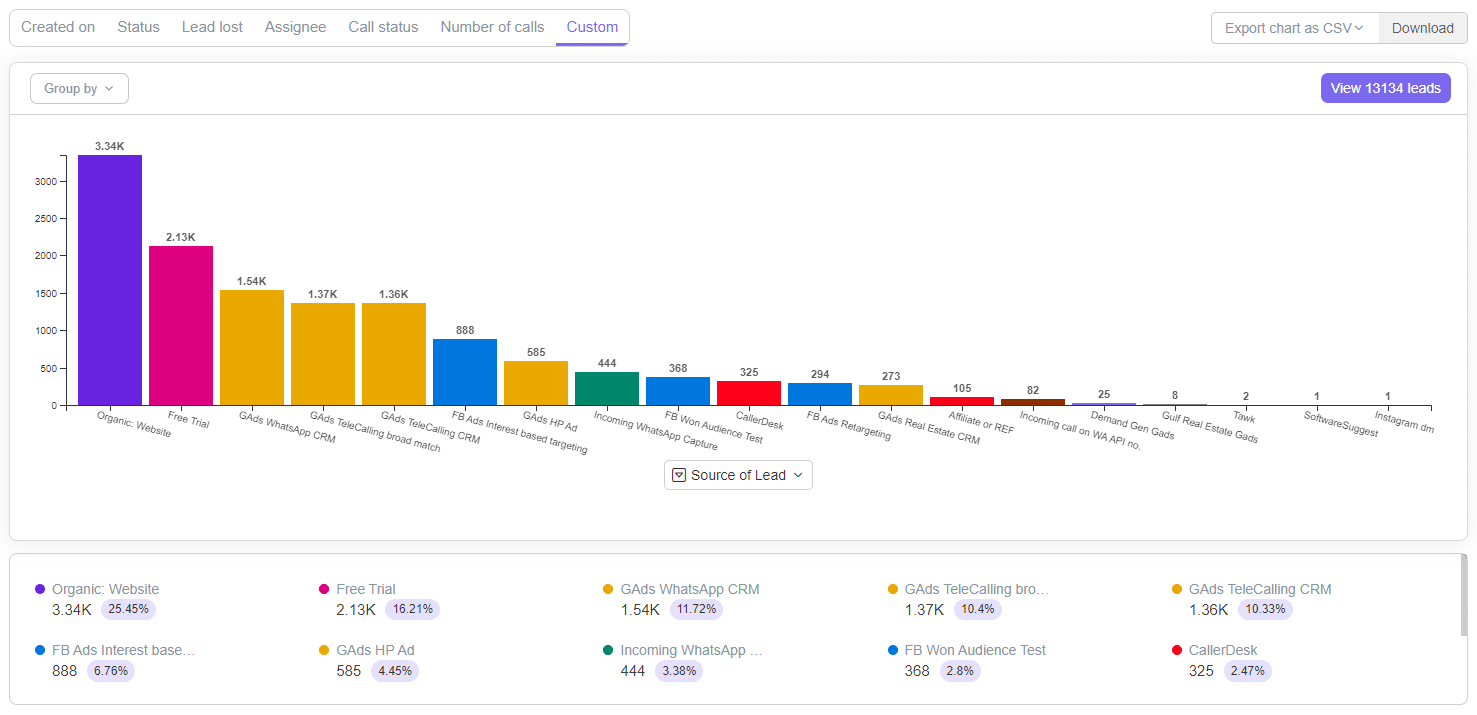
Another use case of Telecrm’s Filter feature is you can generate comprehensive lead generation reports and get details about the number of leads coming from different lead sources in your business.
A team activity report tracks the daily activities of your sales team, such as calls made, meetings scheduled and emails sent, providing insights into the productivity of your sales force.
Purpose: To monitor and evaluate the daily activities of the sales team
Audience: Sales managers and team leaders who need to track sales productivity
Key metrics: Number of calls, meetings, emails, follow-ups and outcomes of each interaction
Benefits: Helps in identifying high-performing sales reps, improving productivity and ensuring that the sales team is focusing on high-impact activities
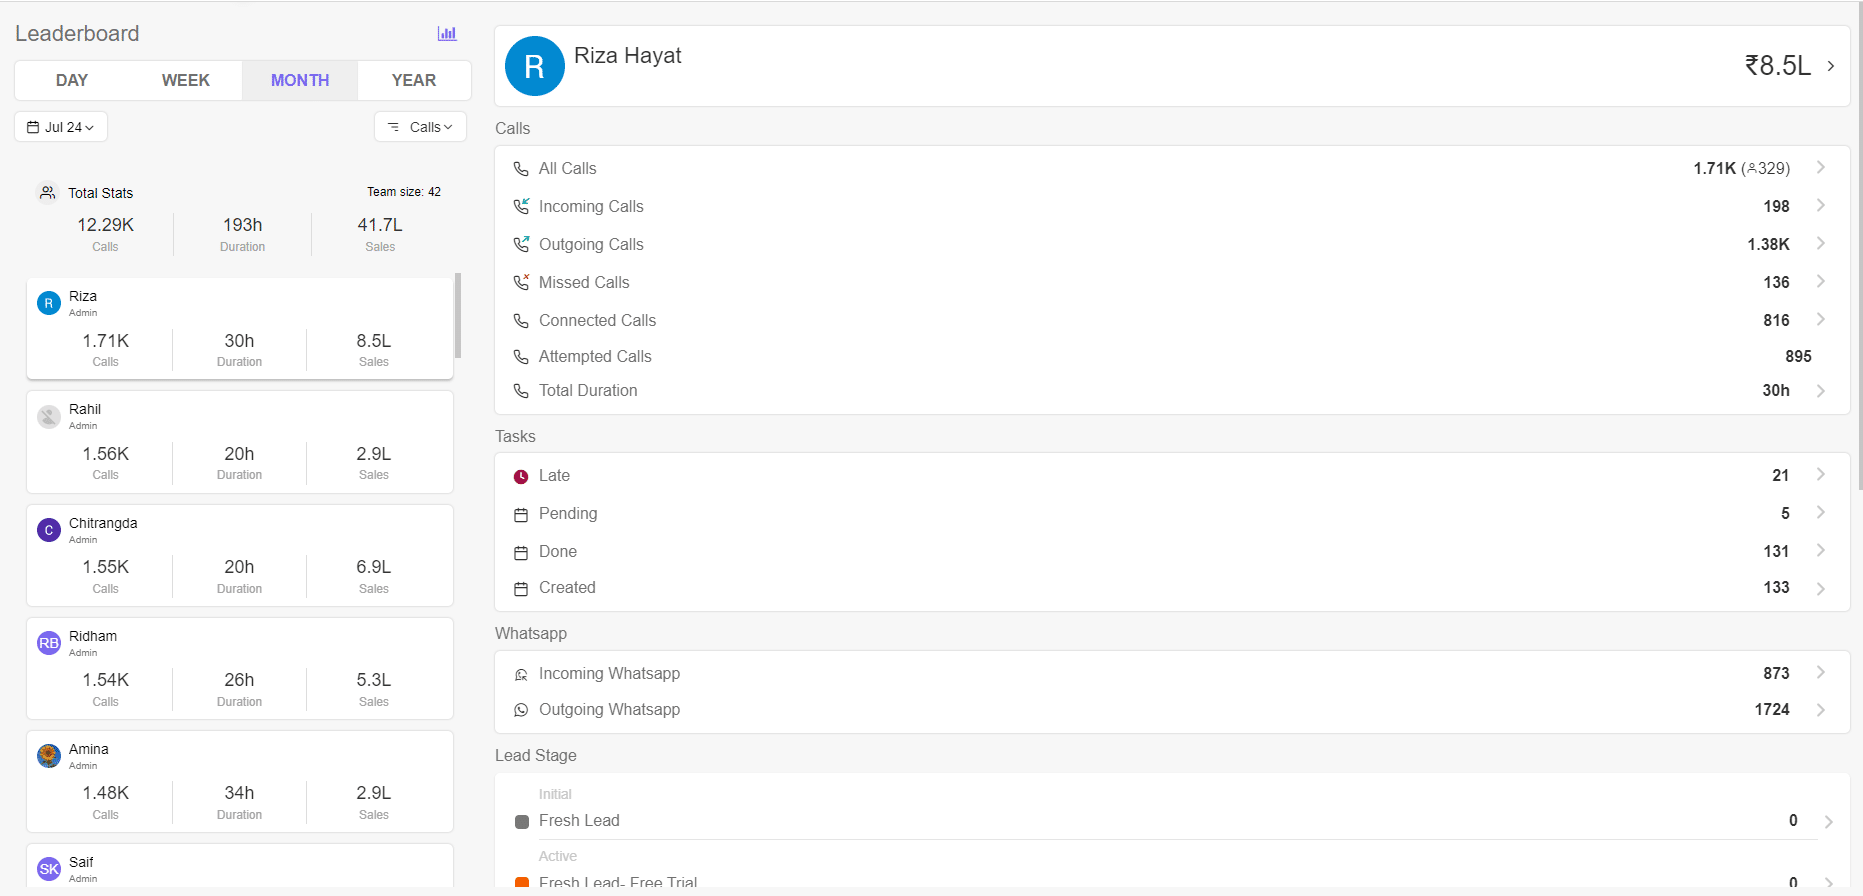
Telecrm’s Leaderboard feature makes it super easy for you to generate team activity reports that have all the information from calls made in a day to a year. All of this data combined with the duration of the calls and the value of sales generated from those calls give you the perfect overview of your team’s activities.
A sales funnel analysis report examines the performance of the sales funnel, identifying how leads move through the stages and where potential drop-offs occur.
Purpose: To analyse the efficiency and effectiveness of the sales funnel
Audience: Sales managers and marketing teams who need to optimise the sales process
Key metrics: Conversion rates at each funnel stage, time spent in each stage, number of leads entering and exiting each stage
Benefits: Helps in identifying and addressing drop-off points, improving lead conversion rates and enhancing the overall efficiency of the sales funnel
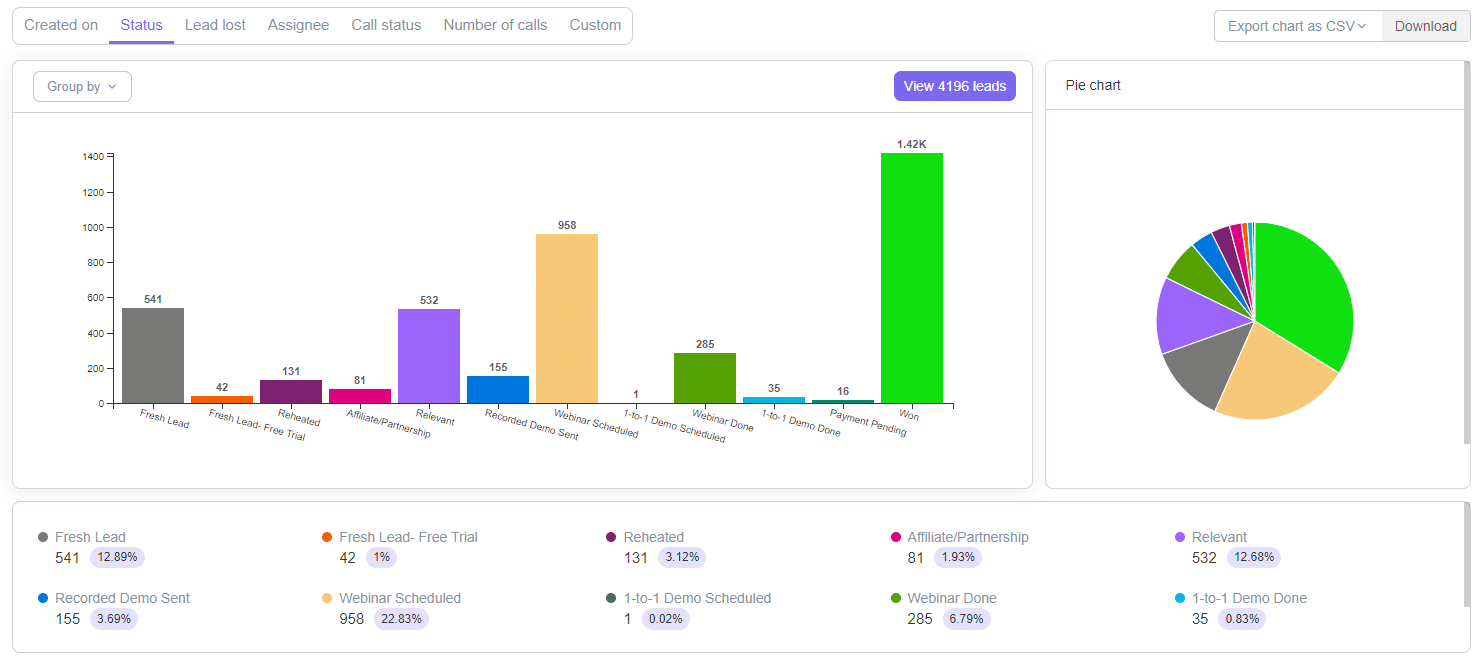
A sales conversion report focuses on the efficiency of converting leads into actual sales, providing you with insights into the sales funnel’s productivity.
Purpose: To investigate the conversion rates and efficiency of the sales process.
Audience: Sales manager, marketing teams and senior management.
Key metrics: Number of leads, conversion rates at each stage of the sales funnel and total conversions at the end of a month, quarter or year.
Benefits: Helps you in identifying bottlenecks in your sales funnel, improving lead nurturing processes and enhancing the overall efficiency of sales in your business. Additionally, provides you with insights into the success of your sales and marketing strategies.
With Telecrm’s Lead Status feature, you can track how many leads have been converted to paying customers by your team and how many have either been lost or are still in nurturing.

A sales forecast report provides predictions of future sales based on historical data, current trends and market conditions, helping you plan and allocate resources effectively.
Purpose: To predict future sales and guide strategic planning
Audience: Senior management and sales managers involved in planning and resource allocation
Key metrics: Projected sales, historical sales data, market trends and pipeline opportunities
Benefits: Helps in setting realistic sales targets, planning inventory and resources and aligning sales strategies with market conditions

A product performance report evaluates how individual products or product lines are doing, helping you understand which products or categories of products are driving revenue and which ones need improvement.
Purpose: To assess the sales performance of different products or product lines
Audience: Product managers, sales managers and marketing teams
Key metrics: Sales volume and revenue by product, growth rates, market share and profitability of each product
Benefits: Evaluate the top-performing products, make informed inventory decisions and develop targeted marketing strategies along with insights into product demand and customer preferences
A CAC report focuses on the cost associated with acquiring new customers, providing insights into the performance and impact of your marketing and sales efforts.
Purpose: To evaluate the costs and effectiveness of acquiring new customers.
Audience: Marketing teams, sales managers and financial planners.
Key metrics: Include all costs related to marketing and sales efforts. This can encompass salaries, advertising expenses, software costs, agency fees and any other costs associated with attracting and converting leads.
Benefits: Helps in evaluating the efficiency of marketing and sales strategies, optimising spending and improving the overall cost-effectiveness of customer acquisition.
Here’s a look at some essential sales report templates you can use to streamline your reporting process and get the most out of your sales data.
A daily sales report provides an immediate snapshot of sales activities, so you can track daily performance and spot any issues as they arise. This allows for quick adjustments to sales strategies.
Here is a template you can use to capture data about your daily revenue. This template gives you a simple and clear structure for creating a report on the revenue generated each day. You can customise it to add or change metrics based on your specific needs.
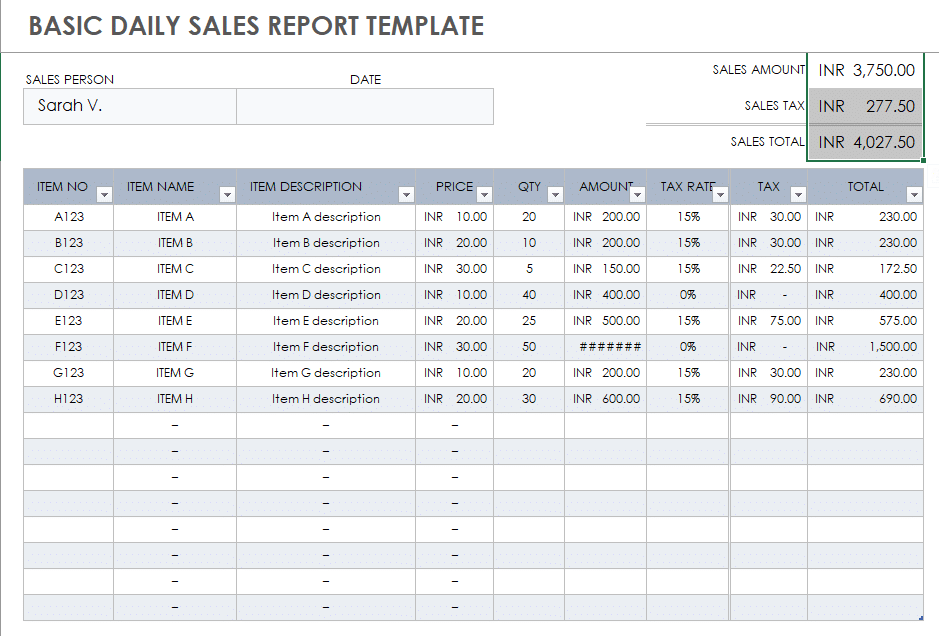
Click here to download the template for your next daily report.
A weekly sales report offers a broader view of sales activities over a week so that you easily identify short-term trends and performance patterns and make changes wherever required.
This template allows you to create reports on the number of calls made by your team in a given week. You can tweak the metrics here as well to prepare a report according to your needs.
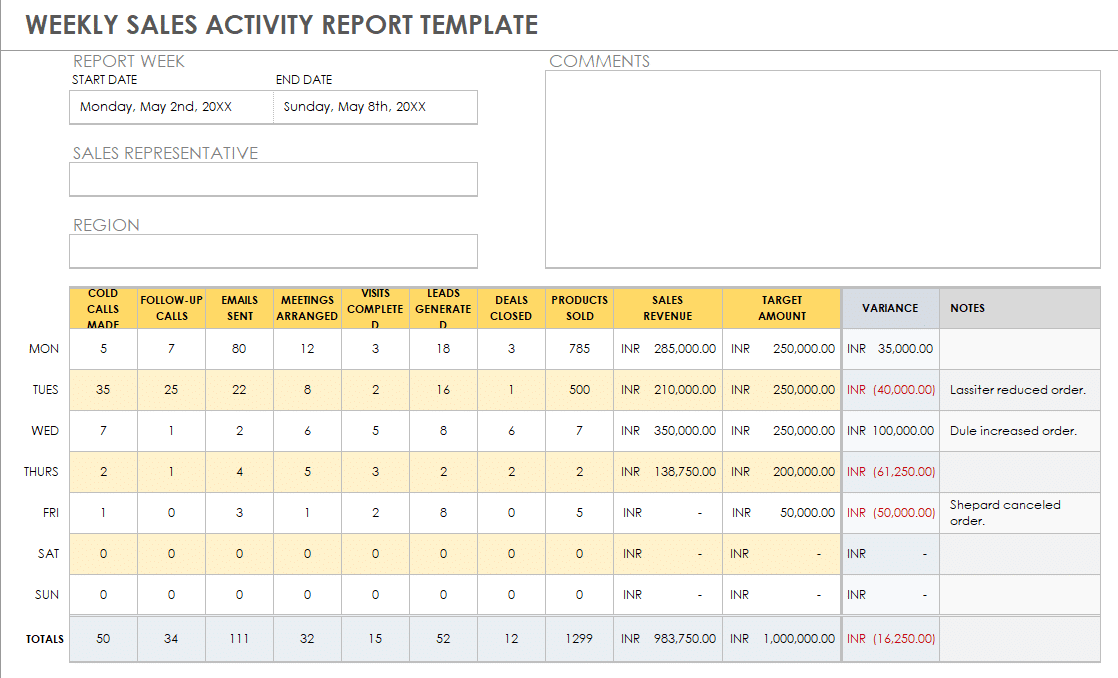
Click here to download the weekly sales report templates.
A monthly sales analysis report provides a comprehensive look at the sales data for the entire month, so you can have a detailed analysis of trends and performance.
This template will allow you to create a monthly report on the number of leads you have successfully converted into customers that month.
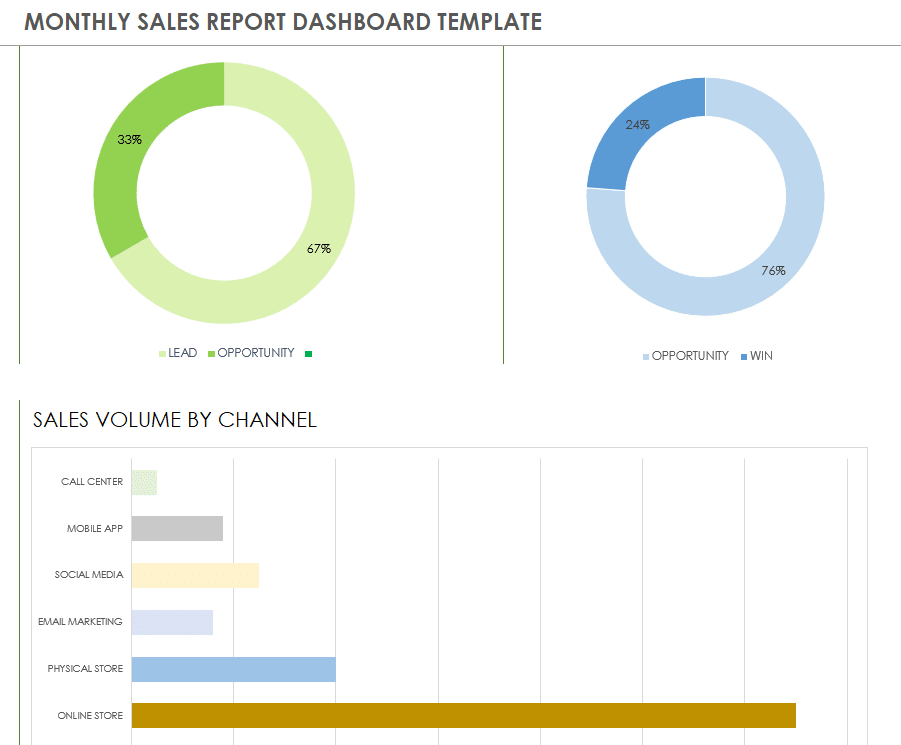
Download the monthly sales report template from here.
A quarterly sales trends report gives you an overview of sales data over a three-month period, providing you with insights into seasonal trends and long-term performance.
Use the quarterly sales report template provided below to generate reports to check the effectiveness of your current sales funnel, check how leads are doing at different stages and whether there is a leak or not.
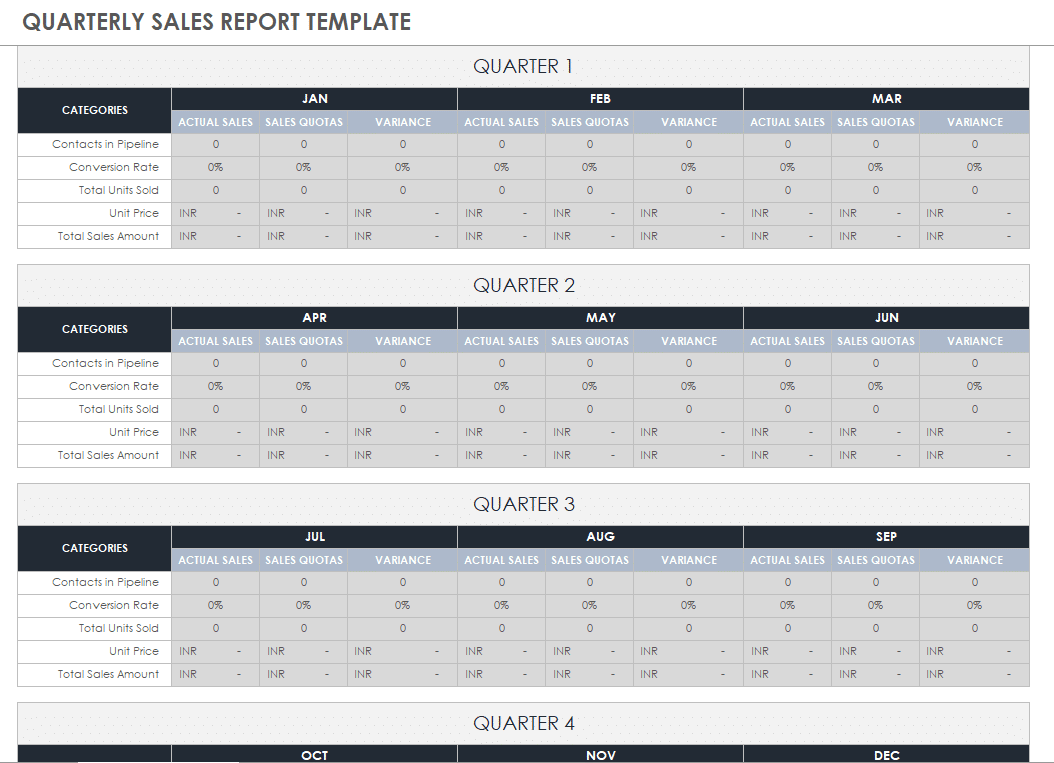
Download the template from here
An annual sales summary report offers a year-long overview of sales activities, highlighting major achievements and identifying areas for improvement.
Finally, here’s the annual sales report template to write your next report on the total number of deals closed, targets achieved and revenue generated in the previous fiscal year.
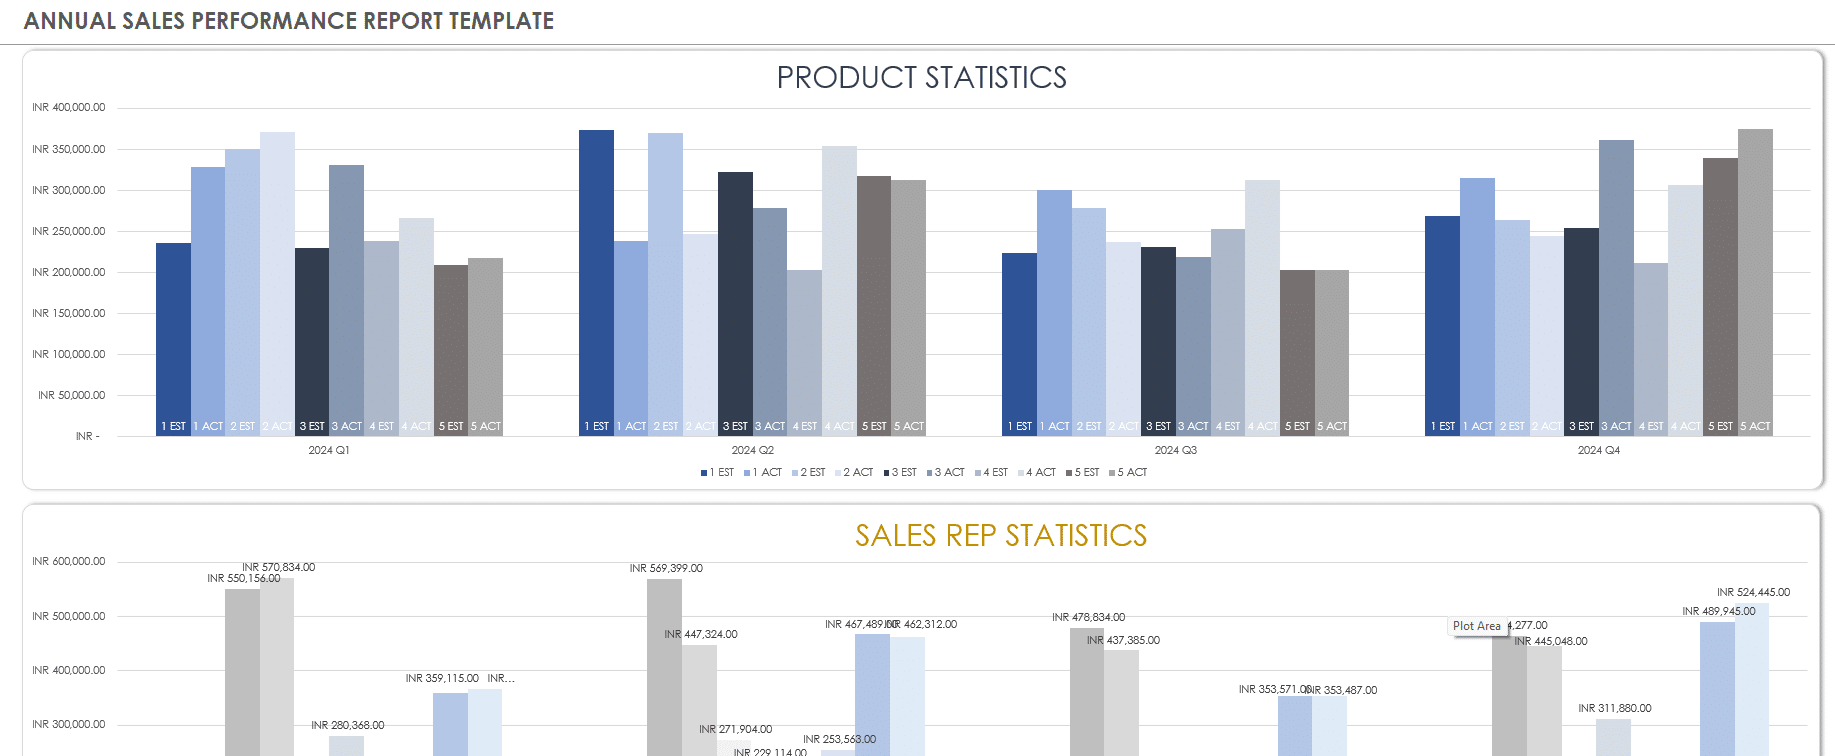
Click here to download the annual sales report template.
Creating effective sales reports is essential for optimising your sales strategy and improving performance. Here’s a recap of the key points covered:
Types of sales reports: Sales pipeline, lead generation, team activity, sales funnel analysis, sales conversion, sales forecast, product performance and customer acquisition cost.
Sales report benefits: Spot trends, make quick decisions, boost team performance and gain customer insights.
Steps to creating a successful sales report:
Define purpose, audience and metrics: Clearly understand your objective with the report, who it is for and the relevant metrics you need to include in it
Time frame specification and data collection: Choose the correct time frame (day, week, etc.) for your report along with gathering accurate and relevant data
Data analysis and insights: Examine trends, identify anomalies and provide actionable recommendations
Clear presentation with visuals: Use charts and graphs for clarity and include an executive summary for quick insights
Editing, review, distribution and discussion: Prioritise accuracy over velocity and share the report with both internal and external stakeholders to turn insights into action
Ready to make your sales reporting effortless yet impactful? All you have to do is this: book a demo with Telecrm (Sales CRM). And watch firsthand how our product delivers effective sales reports geared to your various needs in seconds.


© Copyright 2025 Telecrm.in - All Rights Reserved • Privacy Policy • T&C


© Copyright 2025 Telecrm.in - All Rights Reserved • Privacy Policy • T&C